Orchestrating and publishing dashboards
Once you have created your charts, you can assemble them to curate a dashboard. Dashboards are your tool to transform data insights into a holistic overview of key metrics and trends, enabling data-driven decision-making in your organization.
Prerequisites
-
You have the Data Browser Editor role.
-
You have created your data charts.
How to proceed
To orchestrate and publish a dashboard:
-
Click Dashboards from the upper ribbon in the Home screen. You are displayed an overview of all dashboards already created — both in Draft and in Published state.
-
Click the Add new dashboard button
 .
.
An empty dashboard is displayed and you can start assembling it by adding charts and layout elements. On your right handside you have all your charts listed, as well as layout elements to curate your dashboard exactly the way you want. -
Click the Layout elements tab and create the skeleton of your dashboard.
-
Drag and drop your charts into the skeleton.
-
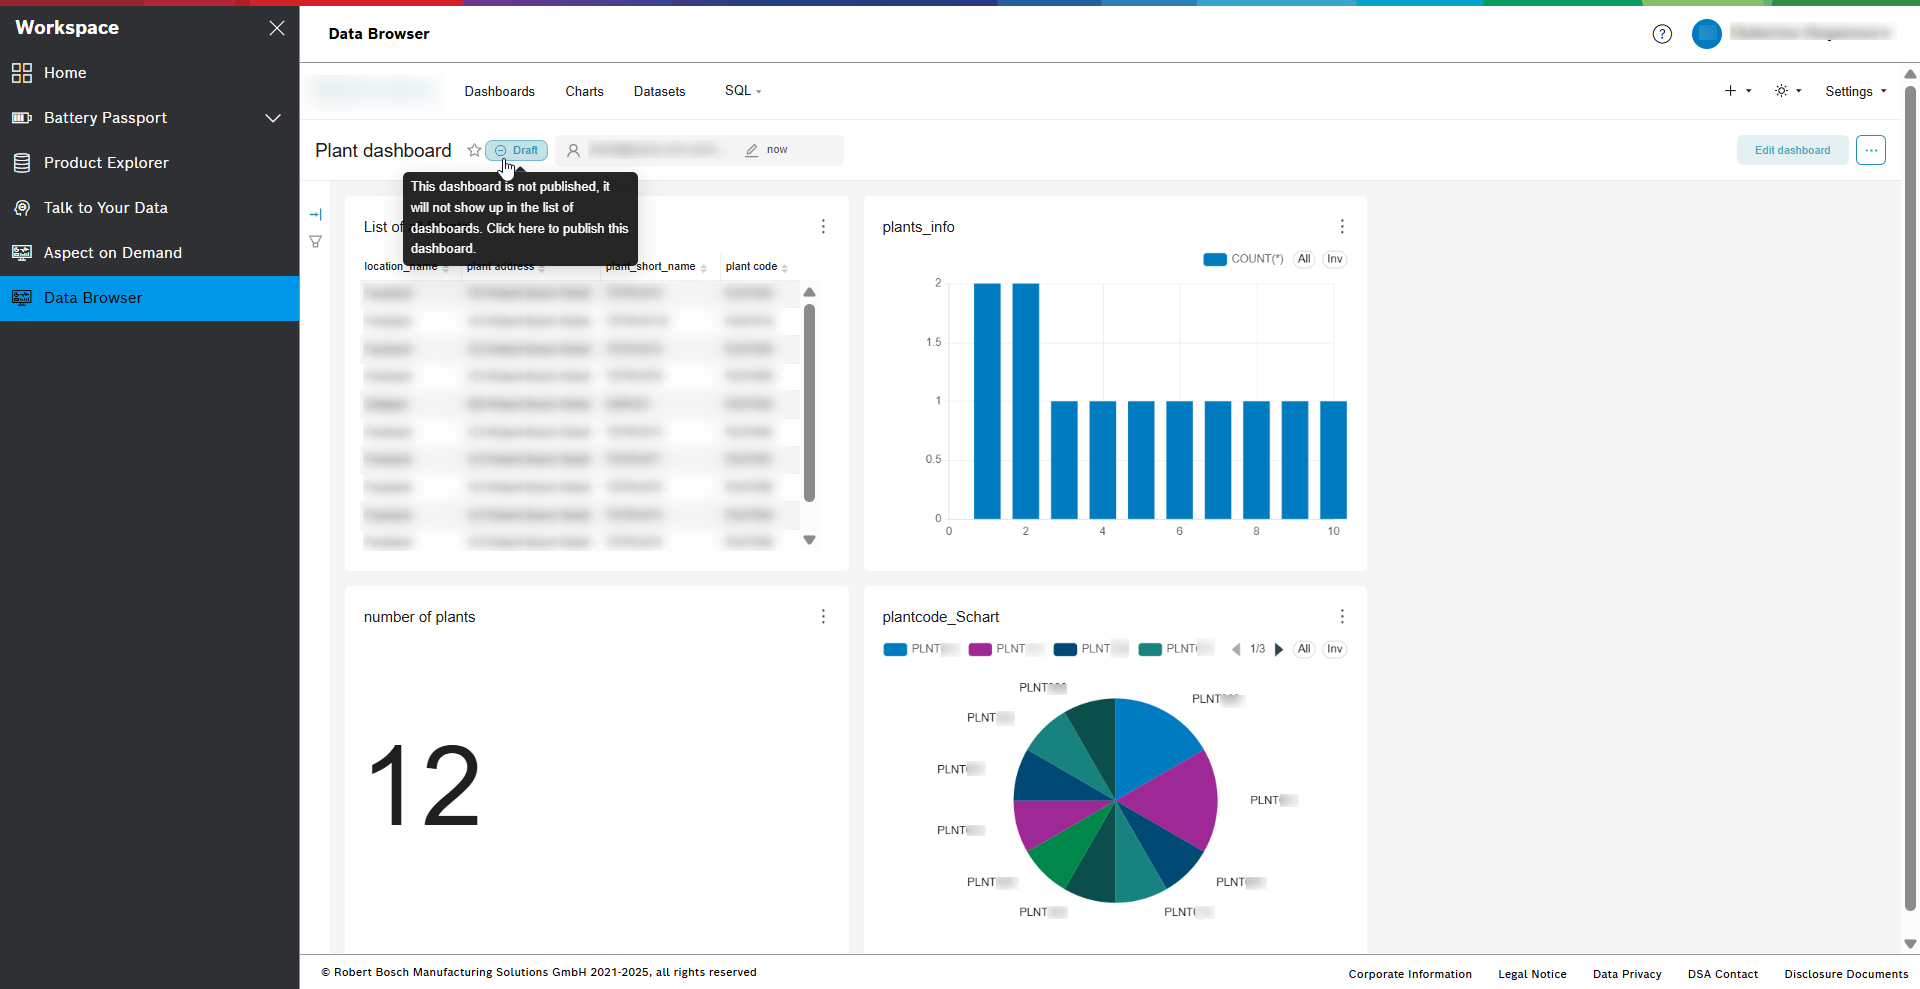
When you are done, don’t forget to name your dashboard, and save it by clicking the Save button up right. Your dashboard is now listed in the overview, but is not published yet and is in Draft state.
-
Publish by clicking on the Draft button next to the dashboard’s name.