Scatter plot
The two-dimensional scatter plot displays the value of a selected process parameter over time for a selected set of processed parts. The scatter plot gives you more detailed information about the individual parts in the product instances.
The set of processed parts displayed in the scatter plot is determined by the following filters:
-
Product hierarchy (Product > Product Instance)
-
Process parameter
-
Production time window
-
Production result state
Display scatter plot
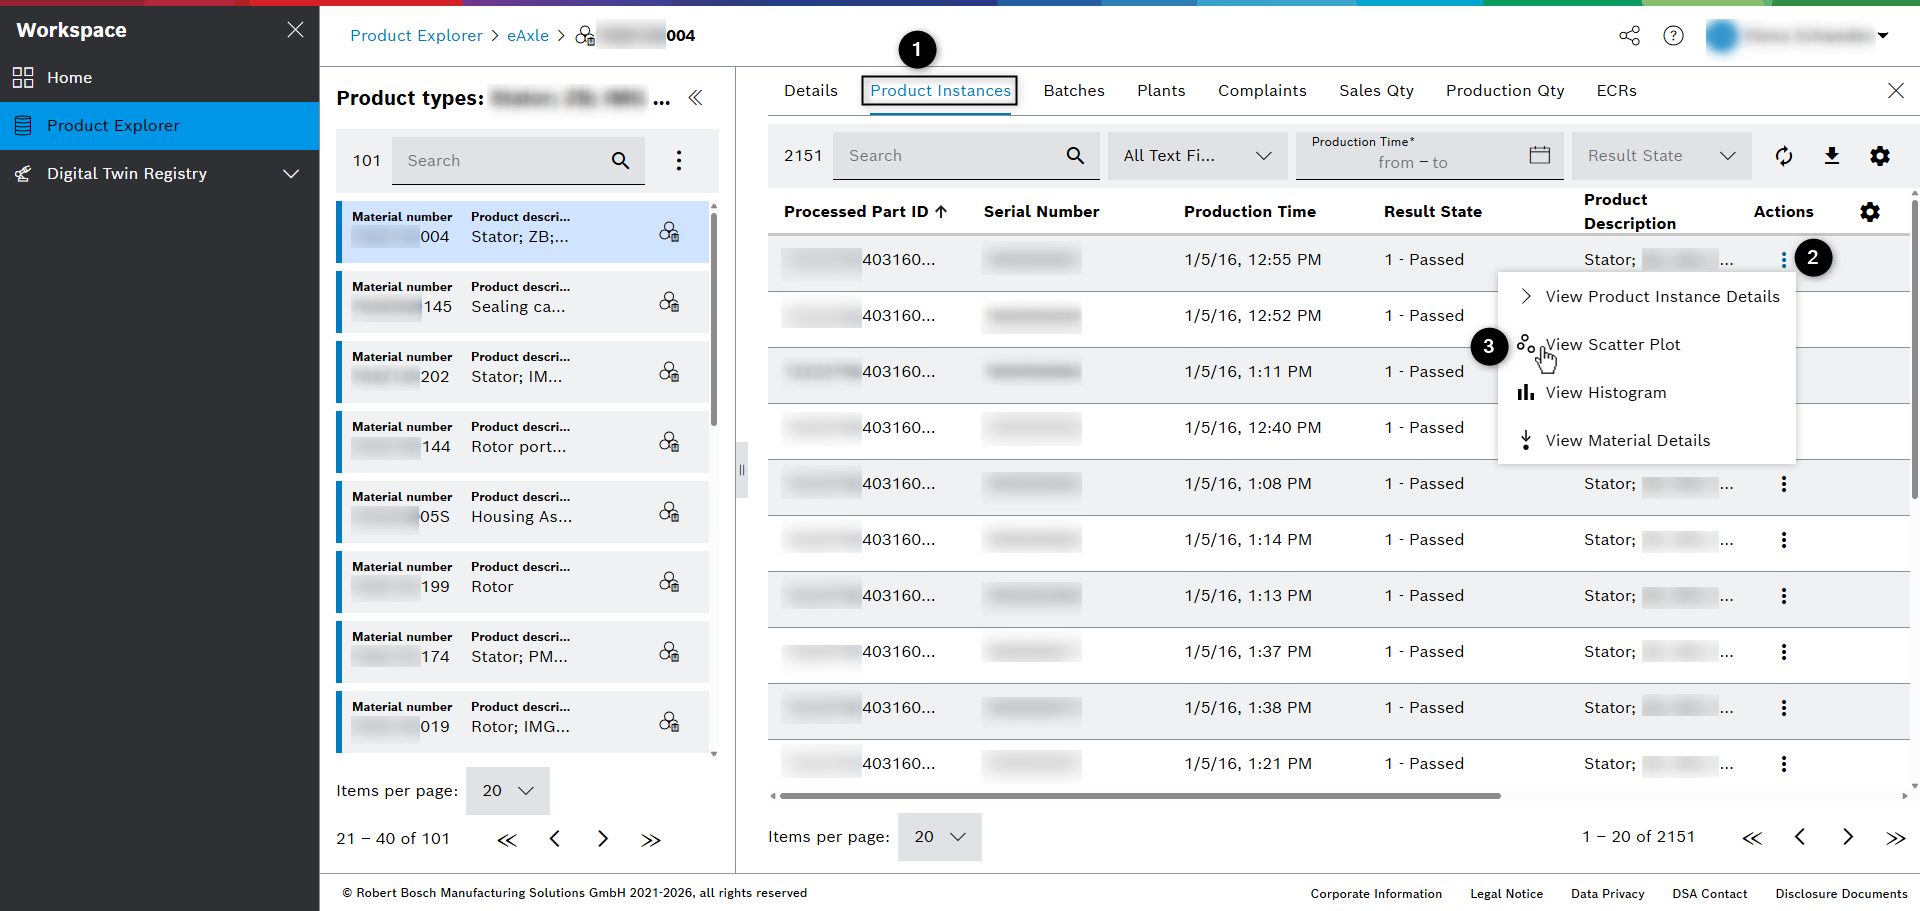
Prerequisite: Product Family and Product types are selected.
-
Click the Product instances tab in the product types view.
-
Open the actions menu with clicking on the three dots in the Actions column.
-
Click View Scatter Plot.
→ Scatter plot view is shown.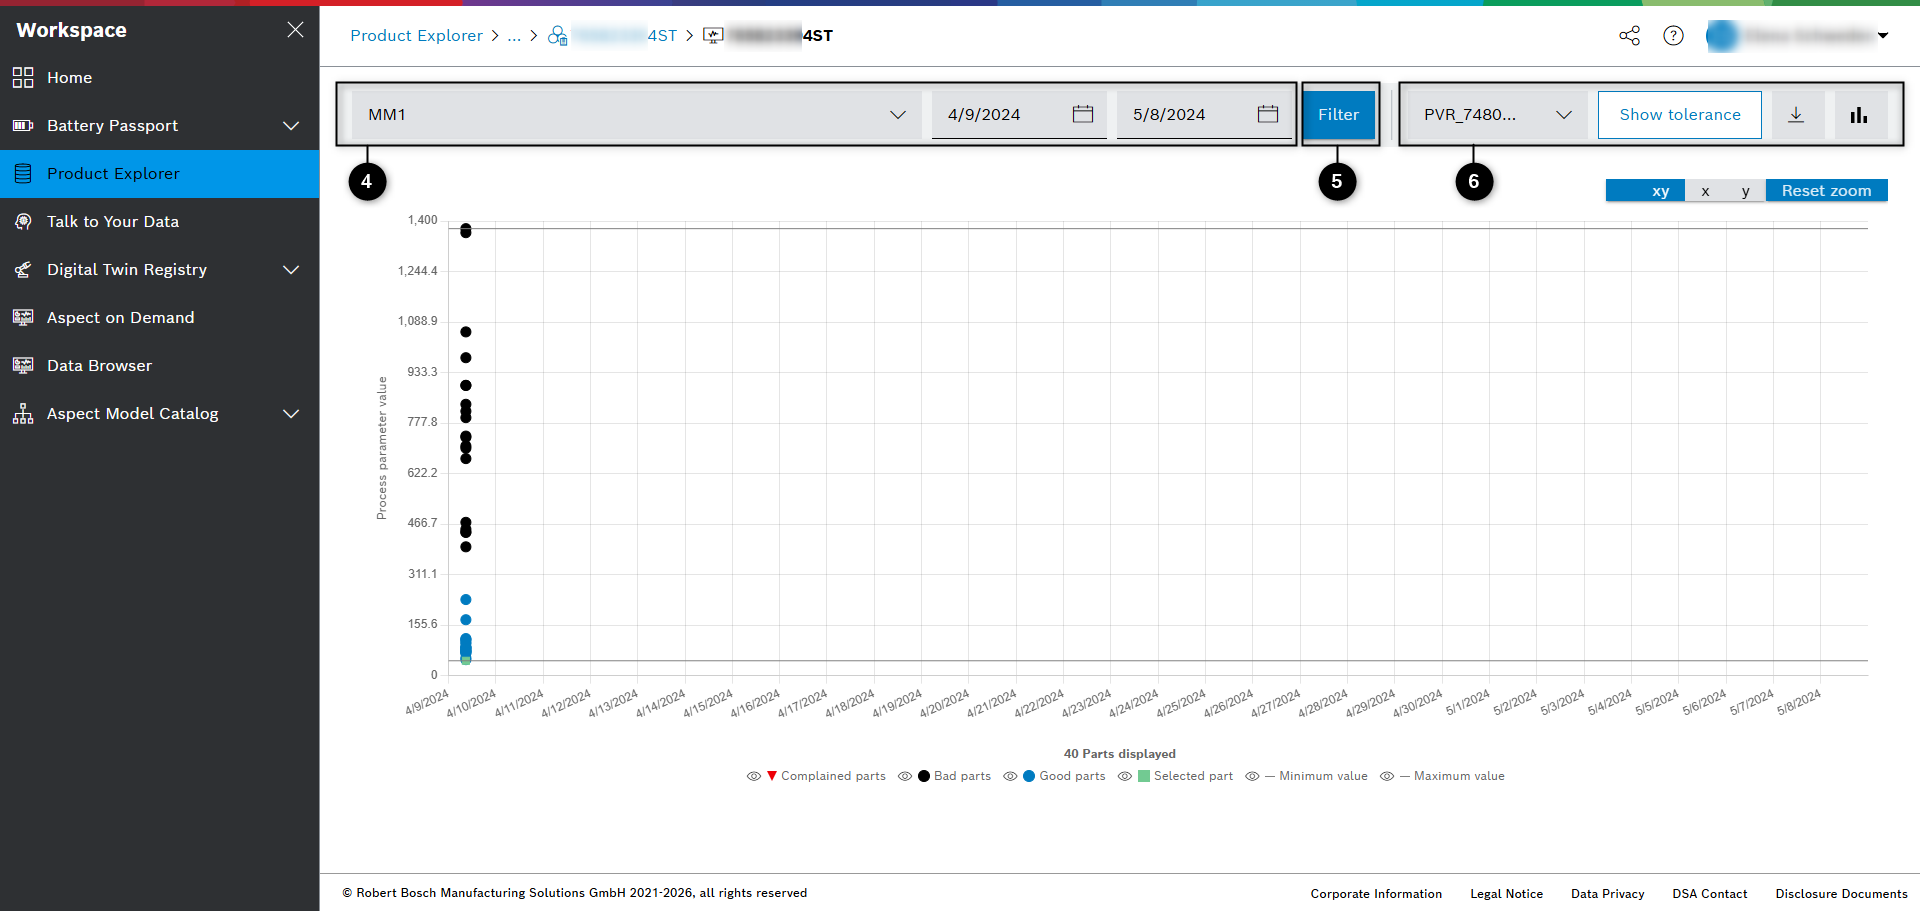
-
Enter
-
process parameter
-
start time
-
end time
-
-
To display the scatter plot, click the Filter button.
-
Aditionally, you can
-
select a part ID
-
show/hide tolerance
-
download CSV file
-
switch between histogram and scatter plot
-
With hovering over the dots more details are shown.
You can simply switch between scatter plot and histogram using the chart icon button in the upper right corner.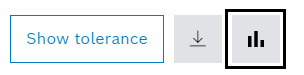
|