Histogram
The two-dimensional histogram displays the production process parameters. The histogram allows you to visually identify patterns for the causes of claimed parts.
The following information can be displayed:
-
Min and max value of the process parameter
-
Set point of the process parameter
-
Upper and lower tolerance of the process parameter
Display histogram
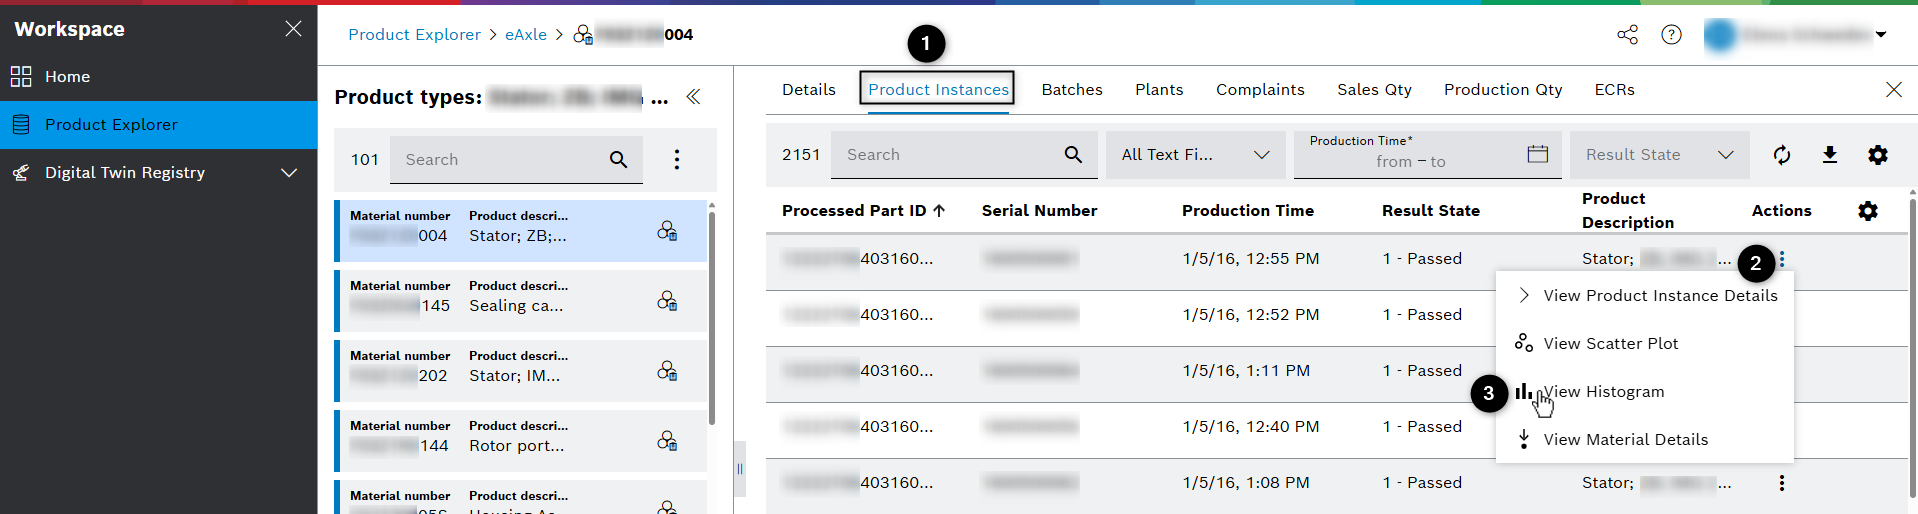
Prerequisite: Product Family and Product types are selected.
-
Click the Product instances tab in the product types view.
-
Open the actions menu with clicking on the three dots in the Actions column.
-
Click View Histogram.
→ Histogram view is shown.
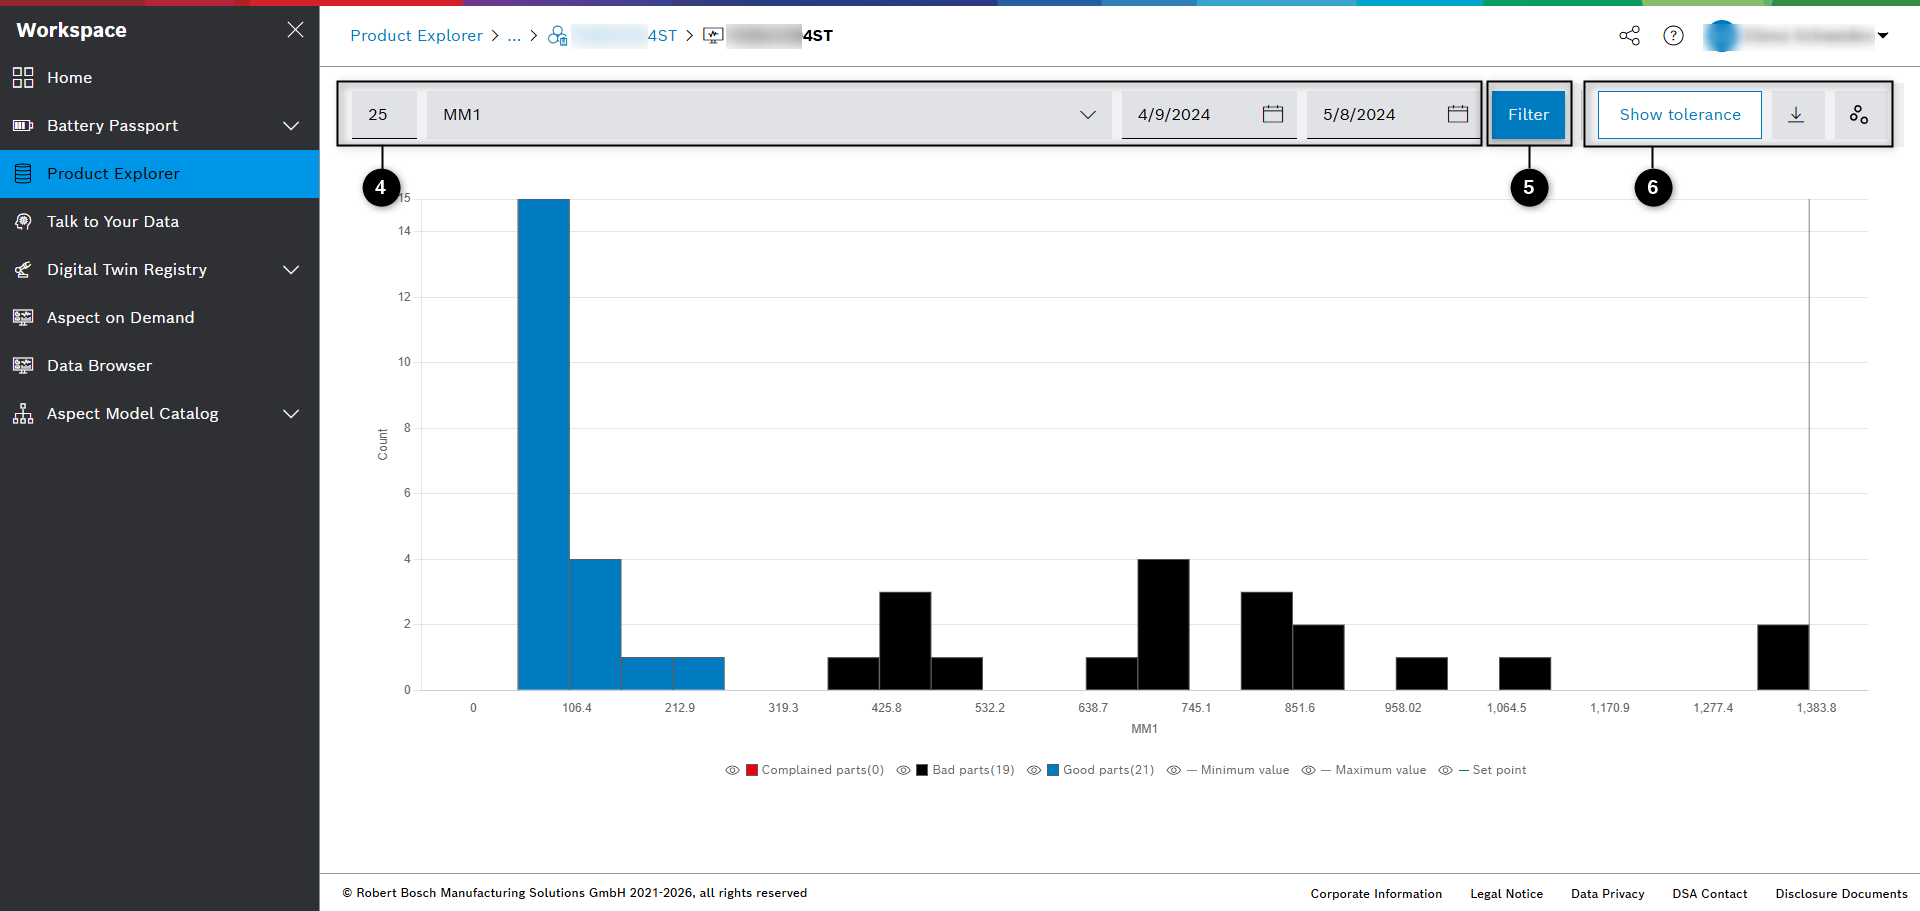
-
Enter
-
value
-
process parameter
-
start time
-
end time
-
-
To display the histogram click the Filter button.
-
Aditionally, you can
-
show/hide tolerance
-
download CSV file
-
switch between histogram and scatter plot
-
With hovering over the bars more details are shown.
You can simply switch between scatter plot and histogram using the chart icon button in the upper right corner.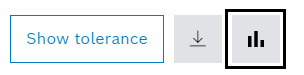
|